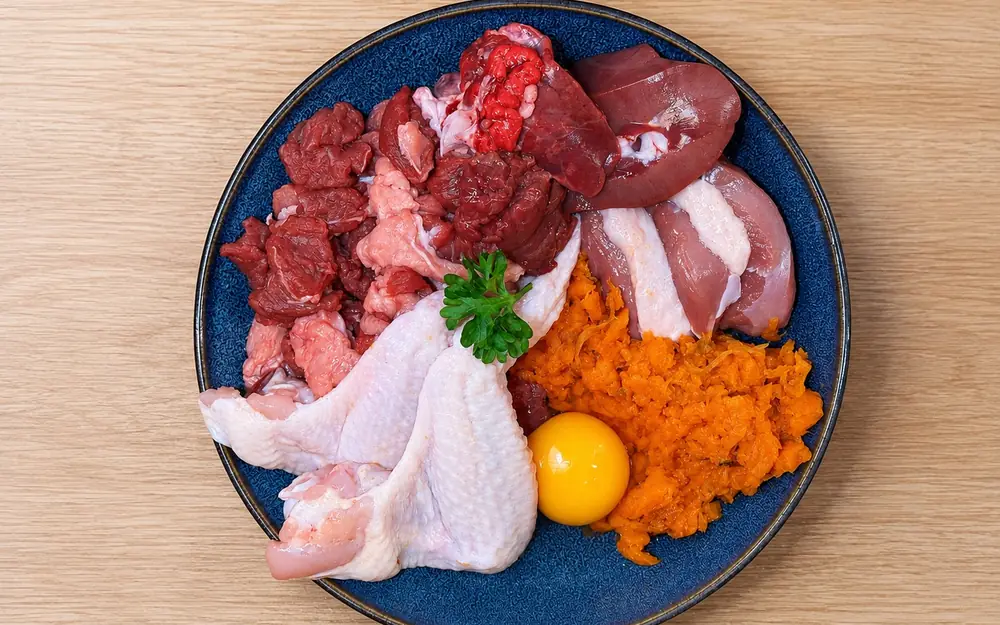
After cooking, the same food may weigh less, while individual nutrients do not all change to the same degree. That is why comparing “100 g raw” with “100 g cooked” can be misleading: those portions may represent different starting amounts of food.
Yield, retention, and the value per 100 g
Weight yield describes the change in the weight of the edible portion during processing. Meat may lose water, juices, and some fat, so the cooked portion often weighs less. Other foods can absorb water and weigh more [1].
Nutrient retention describes the proportion of the nutrient's total starting amount that remains after processing. USDA calls this “true retention” and calculates it from both nutrient concentration and food weight before and after cooking [2].
Content per 100 g is a different measure again. After water loss, a nutrient can have a higher value per 100 g of cooked food even though its total amount in the whole portion has fallen. Estimating the cooked portion therefore requires both the weight change and nutrient retention.
What the Bognár and USDA tables contain
Bognár compiled weight-yield factors for about 700 foods and dishes and average retention factors for 39 food categories. USDA Release 6 covers 16 vitamins, 8 minerals, and alcohol for approximately 290 foods across different preparation methods [1,2].
These are reference data used when a laboratory analysis of the particular cooked food is unavailable. They are not universal constants. The result depends on the food, method, time, temperature, equipment, and whether cooking liquid or juices are included. Bognár also notes that data for some vitamins, fatty acids, and amino acids were incomplete and that some factors were estimates [1]. USDA likewise contains both analytical and imputed values [2].
Cooking liquid changes the result
Bognár's tables distinguish retention in the solid part from retention in the total dish, including broth, gravy, or juices. The report specifically notes that whether the cooking medium and dripping juices are included can matter for boiling, steaming, and frying [1].
If a nutrient moves from the meat into the broth, it has not necessarily been destroyed; it may simply no longer be in the drained solid. If the liquid is served, the whole dish should be counted. If it is discarded, it should not be credited to the bowl.
This also applies to minerals. There is no single “mineral loss” percentage: retention of sodium, potassium, magnesium, calcium, phosphorus, or iron must be interpreted for the food category, method, and the part of the dish that is actually served [1,2].
Vitamins do not all behave alike
Processing can affect vitamins through both heat and movement into liquid. The tables therefore provide nutrient-specific factors; one shared loss should not be applied to every B vitamin, folate, or fat-soluble vitamin [1,2].
Taurine needs separate attention
Taurine is a dietary essential for cats [4]. In the study by Spitze and colleagues, the amount remaining in an ingredient depended on preparation. Among the methods tested, boiling produced the greatest taurine loss, and retaining the juices mattered. The authors linked this pattern to taurine's high water solubility [3].
That does not create one fixed percentage for every meat. Taurine content varied widely among tissues and samples in the same study. A cooked feline diet therefore needs to account for the ingredient, method, and cooking liquid, while the preview above should be treated as indicative [3,4].
Is steaming always gentler?
Steaming limits direct contact with water, but it does not guarantee higher retention for every nutrient. Retention still depends on the food, temperature, time, and loss of juices. With boiling, the result for the whole dish can also differ from the result for drained meat when the broth is served [1].
The sound approach is to choose a factor that matches the food and method, calculate the finished portion weight, and state clearly whether the cooking liquid is part of the meal.
What this means in BARFLAB
Preparation method is part of the calculation because a change in gram weight alone cannot describe the unequal changes in individual nutrients. The preview above shows the direction and scale suggested by reference values; it is not a laboratory analysis of a specific batch or an individual assessment of an animal's diet.
Sources
- Bognár, A. (2002). Tables on weight yield of food and retention factors of food constituents for the calculation of nutrient composition of cooked foods (dishes). Berichte der Bundesforschungsanstalt für Ernährung, BFE-R-02-03. Karlsruhe. https://www.fao.org/uploads/media/bognar_bfe-r-02-03.pdf
- USDA Agricultural Research Service (2007). USDA Table of Nutrient Retention Factors, Release 6. https://www.ars.usda.gov/arsuserfiles/80400530/pdf/retn06.pdf
- Spitze, A. R., Wong, D. L., Rogers, Q. R., Fascetti, A. J. (2003). Taurine concentrations in animal feed ingredients; cooking influences taurine content. Journal of Animal Physiology and Animal Nutrition, 87(7–8), 251–262. https://www.vetmed.ucdavis.edu/sites/g/files/dgvnsk491/files/aal/pdfs/spitze.pdf
- National Research Council (2006). Your Cat's Nutritional Needs: A Science-Based Guide for Pet Owners, based on Nutrient Requirements of Dogs and Cats. https://nap.nationalacademies.org/resource/10668/cat_nutrition_final.pdf